Resource Usage
Peak Memory
Introduction
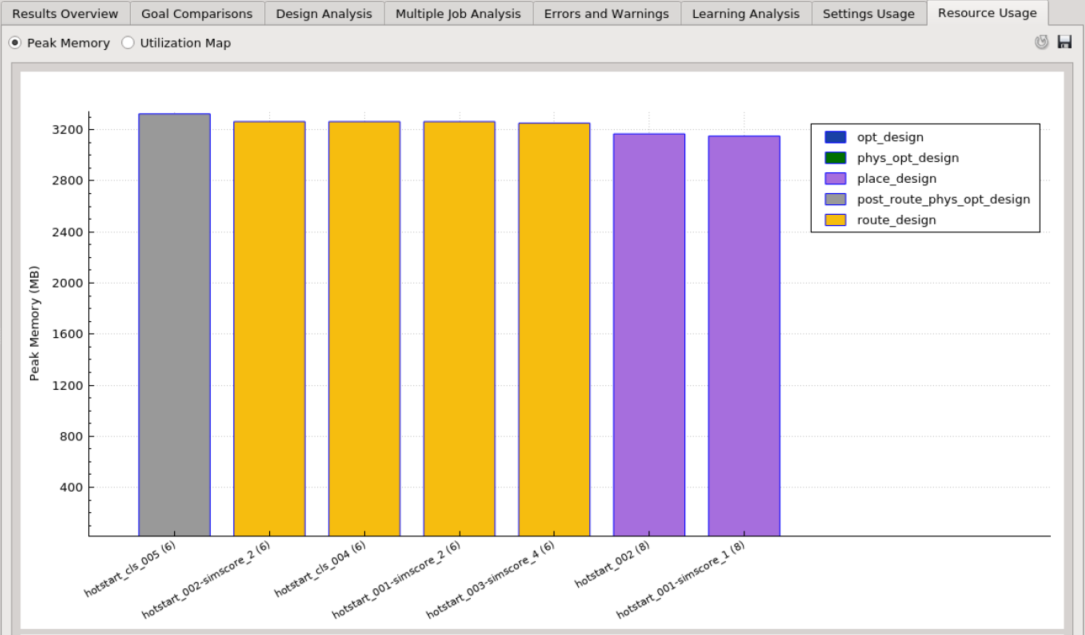
The Resource Usage (Peak Memory) tab shows the memory usage for every selected strategy.
Peak Memory Chart
The x-axis shows the name of the strategy, and the y-axis shows the peak memory (in MB) used for that strategy. The color shows the step in which the peak memory was consumed.
Utilization Map
Introduction
The Resource Usage (Utilization Map) tab shows the utilization percentage across all the clockregions.
Utilization Heatmap
The cells of this heatmap correspond to the device’s clockregions. Cells in green have relatively lower utilization percentages, whereas red cells have relatively higher utilization.
