Multi-die Analysis
Introduction
This section provides insights on die crossings in the design. Specifically, it highlights the frequency and details of critical paths that cross die boundaries. By aggregating multiple results, one can identify results with the least crossings or see if the crossings are performance bottlenecks.
Crossings versus Non-Crossings
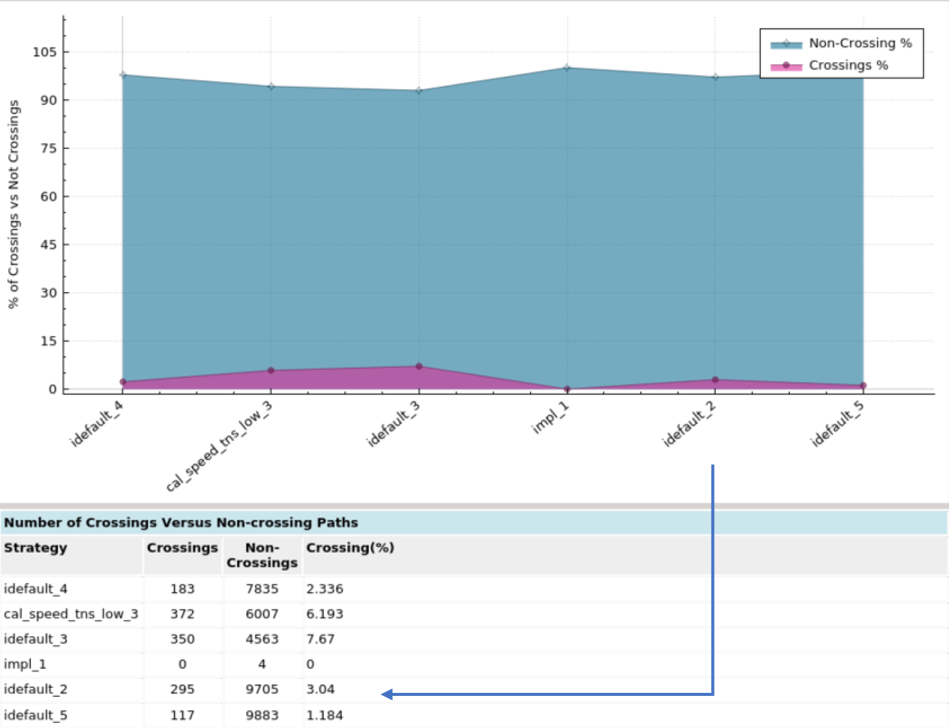
The first chart and table compares the number of critical paths crossing dies versus those not crossing dies. Generally, a lower percentage of path crossings correlates to better overall design performance.
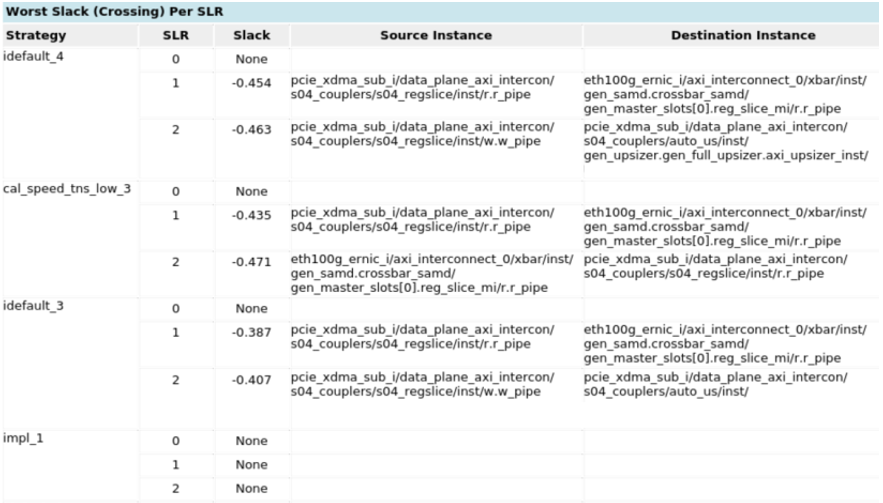
Worst Crossing Per Die
This table shows which path has the worst slack that crosses one or more dies. It also shows the source and destination die.
Total Negative Slack Per Instance
This table groups crossing paths based on source and destination instances. It shows which instance has the highest aggregate slack that crosses one or more dies.
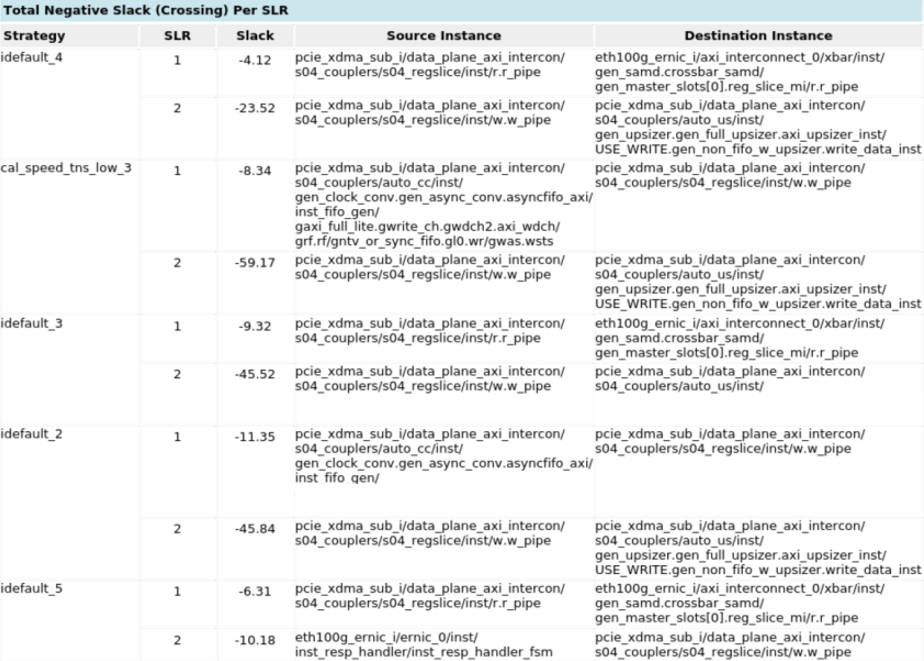
Overall, the multi-die analysis provides insights into which instances are responsible for inter-die slacks and how these instances can be better placed.